Results
After running the correlations of the compensation variables and the firm performance score for each case, we found the following results.
Correlation Tables
Correlation Between CEO Payment and Firm Performance:
| Firm Size | Correlation |
|---|---|
| Small | 0.241048 |
| Medium | 0.027822 |
| Large | 0.077771 |
There is a stronger correlation between CEO overpayment and firm performance for small firms, but a much weaker one for medium and large ones. It can be inferred that CEO payment has a greater impact on the performance of these smaller firms because they are more volatile and having a good CEO will go further towards firm success.
Correlation Between Director Payment and Firm Performance:
| Firm Size | Correlation |
|---|---|
| Small | -0.0116239 |
| Medium | -0.047808 |
| Large | -0.027887 |
We found a similar trend for directors but in the negative direction. There is a strong negative correlation between BOD overpayment and firm performance for smaller firms and a weaker negative correlation for those of medium and large size. This further supports the idea that keeping a good CEO is far more important for smaller firms than for those of the larger two sizes.
Correlation Graphs
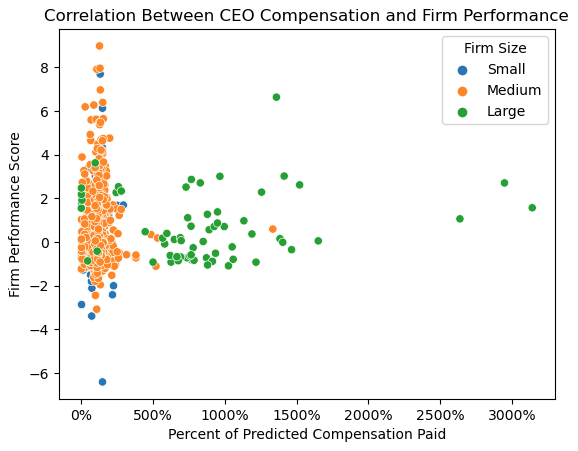
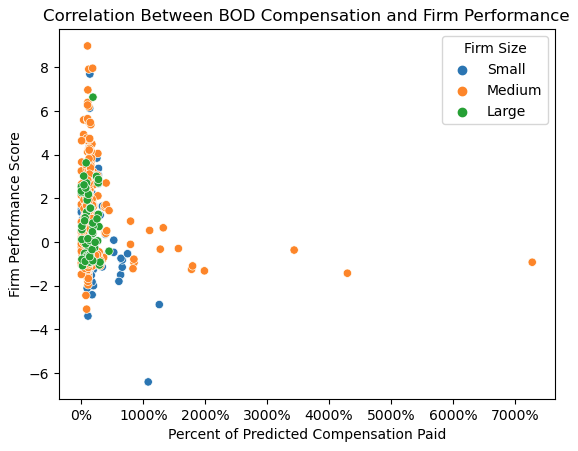
There is a larger scale for director compensation than there is for CEO compensation with an outlier of director compensation above 7000% of predicted pay. On the CEO side, a separate outlier sits at roughly 3000% of predicted pay. Additionally, it appears that medium-sized firms are responsible for the majority of director overpayment whereas larger firms are more responsible for CEO overpayment. In both cases, compensation values for smaller firms seems to be less volatile than that for the other two size categories. It is possible that this is due to the capital limitations of smaller firms that aren't faced by those of the larger sizes. Even when smaller firm executives are overpaid, it isn't by as great of an amount because the addiditonal capital required for that compensation is most likely necessary elsewhere.
Case Analysis
Average Perfomance Score
| Firm Size | Case | Average Performance Score | Count |
|---|---|---|---|
| Large | 1 | 0.520715 | 31 |
| 2 | 0.638213 | 26 | |
| 3 | 1.755433 | 3 | |
| 4 | 1.784764 | 4 | |
| Medium | 1 | 0.298682 | 583 |
| 2 | 0.151899 | 149 | |
| 3 | 0.054874 | 237 | |
| 4 | 0..078295 | 124 | |
| Small | 1 | 0.077480 | 101 |
| 2 | 0.219309 | 29 | |
| 3 | -0.481463 | 64 | |
| 4 | -0.279931 | 16 |
| Case | Description |
|---|---|
| Case 1 | CEO and BOD both overpaid |
| Case 2 | Ceo overpaid and BOD underpaid |
| Case 3 | Ceo underpaid and BOD underpaid |
| Case 4 | CEO and BOD both underpaid |
Separating out our various firm years in the above four cases, we found that large firms with both CEO and director underpayment perform the best, on average, in the years studied. These numbers are advised by a smaller sample size though. Small firms with underpaid CEO and overpayed BOD perform the worst. It is also important to note that, for large firms, overpayment of the CEO results in poorer performance while it improves firm performance for medium and small firms. Additionally, it is intriguing that smaller firms see a negative performance score when they are underpaying their CEOs. This further emphasizes the importance of generous CEO compensation on the part of firms at the smaller size. If those CEOs are underpaid, they leave, and that is incredibly detrimental to the firms they used to lead. For the larger and medium-sized firms, the effect of this potential turnover is far less evident. In fact, as previously mentioned, the larger firms actually benefit from undercompensation of their executives. Medium firms sit right in the middle, with slightly positive firm performance but not at the magnitude of the measures seen in the other two categories.