Data
We utilized the Wharton Research Data Services for our data sets. All data regarding director and CEO compensation and demographics came from Execucomp. Firm accounting variables and other firm-specific information came from Compustat. We cross referenced multiple studies to find determinants of CEO and director compensation as well as firm performance. Our sample was comprised of firms in the S&P 500 from years 2010-2019. We chose 2010-2019 to avoid the corporate scandals of the early 2000's, the financial crisis in 2008/2009, and the impact COVID-19 had on the market in 2020 and beyond.
BOD Compensation and Determinants
Director compensation was defined as their total compensation. This includes cash, value of stock options and option awards, non-equity incentive plan compensation, change in pension value and "nonqualified" deferred compensation earnings, and all other compensation.
We used accounting-based firm valuations and market performance as determinants for predicting Board of Director compensation. The accounting variables and compensation variables (not including total compensation) are lagged by one year because we are assuming that current total compensation is impacted by the previous years' performance. The accounting metrics of a firm are resilient to equity market changes because these metrics focus on internal firm performance, which will reduce the impact a strong market position will have on predicted compensation. A strong market artificially inflates firm values, even if the firm is not doing well internally. We included market performance determinants in our analysis because BOD packages usually contain some equity incentives as well (Dah and Frye).
CEO Compensation and Determinants
The CEO variables where also lagged by one year not including total compensation, we determined past compensation can be used as an indicator for future comp. CEO determinants are a combination of created variables and stock awards. We created an Ownership Ratio, Ownership Power, Year Served, and Prestige determinants. The Ownership Ratio is the CEO Stock Awards divided by BOD Stock Awards. This variables represent the equity power a CEO holds over a Board of Directors. If a CEO holds more equity than the board, then they hold more power over the company and have a greater influence on the board. We then created a determinant called Ownership Power. This is a binary categorical variable. This variable indicated whether the CEO Ownership Ratio was above the CEO Ownership Ratio median. We predict that CEO's with a higher ownership ratio will have more control over the firm and thus more influence on their pay. For Years Served, we took the difference between the year the CEO was on-boarded and the recorded year. CEO's that serve longer terms are more experienced and are more likely to receive higher pay. We based Prestige Power off of Years Served. Prestige power is a binary categorical variable that indicates whether time served is above the median. This implies a CEO can gain prestige power during their term (Bouteska and Mefteh-Wali)
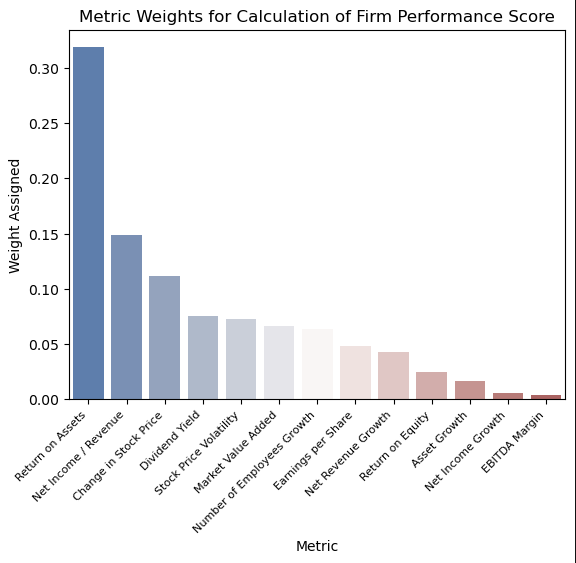
Determinants of Firm Performance
The review written by Sigo explores a wide variety of contributing factors to firm performance: profitability performance, growth performance, market value performance of the firm, customer satisfaction, employee satisfaction, environmental performance, environmental audit performance, corporate governance performance, and social performance. Although this may seem exhaustive, the paper did not calculate any kind of firm performance measure. For our analysis, we focused on the profitability performance, growth performance, and market value performance due to their availability in the Compustat dataset and their quantifiable nature that was necessary for the measure calculation. All of these determinants are later used to predict firm performance.
Exploratory Data Analysis
After querying the data from WRDS, we did an Exploratory Data Analysis or EDA on our data frames. Our EDA leads us to dropping variables deemed unnecessary in our analysis, imputing data into missing or NaN data fields, and creating new variable identifiers.
The data sets that were queried from WRDS were very extensive. We did not have use for all of the variables in the data sets, and selected the ones we determined to be pertinent to our project based on the literature we read. We renamed variables to have more comprehensive labels. For missing data, we imputed values depending on the variable case. For the variables we did not create, we imputed missing values with that variable's mean (done according to market value bins). For example, the Small firms would not be imputed with the Large firms means. We had to normalize the variables we created as well. Some of the divisions resulted in NaN and 'inf' values. We understood that the NaN results came from dividing zero by a value and 'inf' was the result of dividing by zero. We imputed the NaN results to zero and capped the 'inf' results to the maximum value of that variable set.
Out of the two CEO total compensation values, we kept the variable that used the Black Scholes Model to value the options held by the CEO. (TDC1)